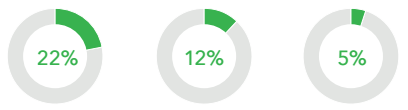
Pie Charts
Use when you have less than six things that add up to 100%. Use the middle of the doughnut to highlight the number or category type. You could also consider using a stacked bar chart instead.
Information about Pie Charts can be found at:
http://cfpb.github.io/design-manual/data-visualization/chart-types.html#pie-or-doughnut-charts
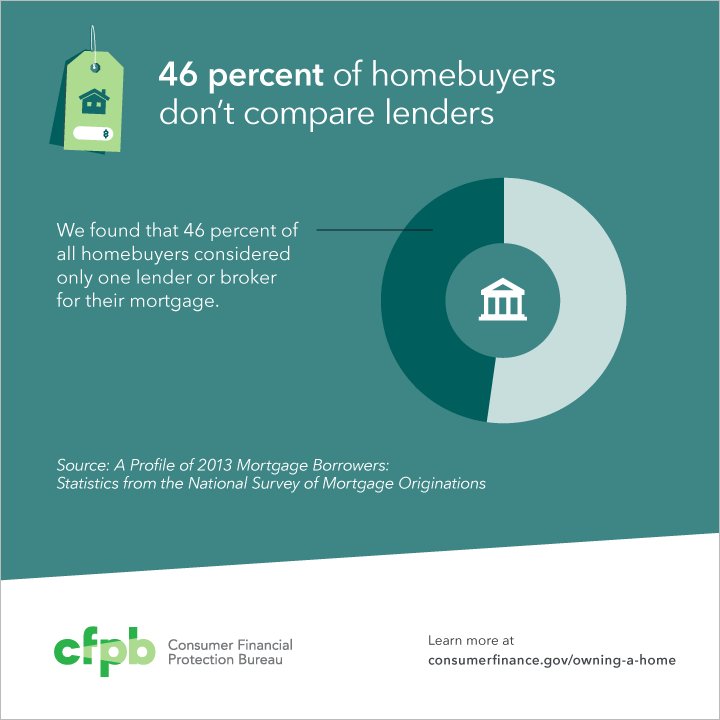
Donut chart
HTML code snippet
<marquee>Some sample code will eventually show up here.</marquee>Donut chart
HTML code snippet
<marquee>Some sample code will eventually show up here.</marquee>Content guidelines
- The slices should add up to 100%. * Use 5 or less slices. * Directly label all slices. * Use a white outline or stroke to create contrast between the slices.