Line Charts
Use when you have one factor over time to show change. Start your axis at 0 and label your axis to avoid confusion.
Information about Line Charts can be found at:
http://cfpb.github.io/design-manual/data-visualization/chart-types.html#line-charts
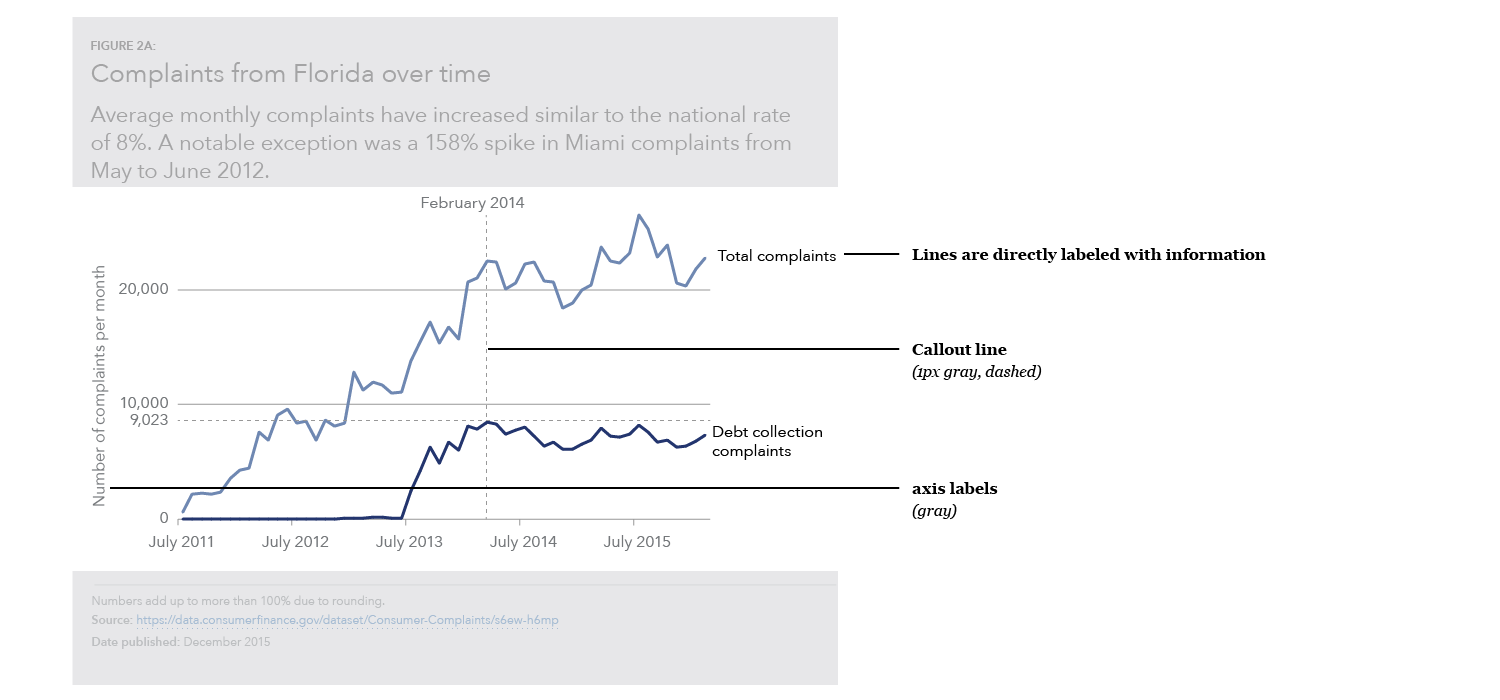
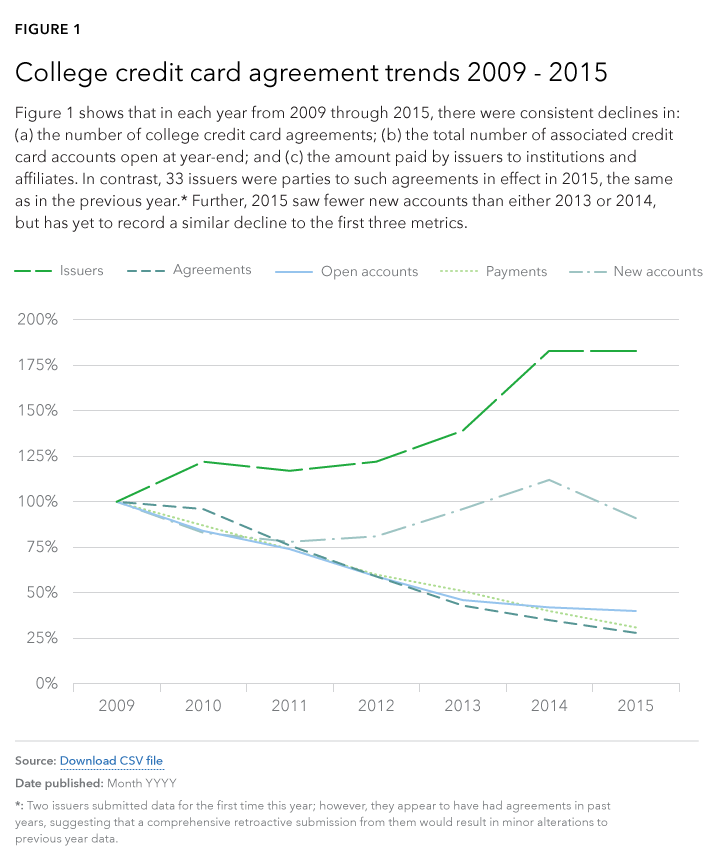
Line chart
HTML code snippet
<marquee>Some sample code will eventually show up here.</marquee>Line chart showing trends
HTML code snippet
<marquee>Some sample code will eventually show up here.</marquee>Content guidelines
- Label your lines directly or use different patterns for each line.
- Generally show five or fewer lines to avoid confusion.
- Consider using many small line charts if you need to show more factors. (These are called small multiples charts.)